
Finance leaders have no shortage of disruptions or uncertainty. What they’re short on is clarity and speed. Rising costs, constant economic curveballs, and the AI boom can have them pivoting five times before they’ve even had their first cup of coffee! In conditions like these, it’s hard for many to know whether their cash flow management strategy is on point and if their accounts receivable (AR) performance is keeping up with the pace of the market.
This accounts receivable benchmark report was created to change that.
Using the industry’s largest AR data network, Billtrust took a deep dive into the data to understand how AR outcomes are shifting and what those shifts mean for finance teams. After analyzing the patterns, three major trends stand out:
AR Performance Data Reveals Key Market Trends
- Finance teams are adapting their strategies in response to macroeconomic conditions, tightening credit management, leveraging accounts receivable automation to help protect their profit margins. One survey of 550 financial leaders indicates that under recent economic pressures, 63% are taking a more conservative approach to cash management.
- AI is having a growing influence on AR’s operational efficiency and performance with payments occurring faster each year and overdue invoices occurring less often. Wakefield Research shows 99% of AR teams that are using AI have accelerated their payment speeds.
- There is rapid maturity in AR digitization particularly in the areas of invoicing and payments, where the vast majority of processes now require little-to-no human intervention. Finance leaders see agility is liquidity. In 2026, 50% CFOs reported that digital transformation is their top priority, according to Deloitte, and a Vanson Bourne ROI study indicates the payout; 95% report that automating AR processes has increased their team’s efficiency.
This is the first edition of our annual AR benchmarking report. Dive in to discover how your operation stacks up – where you lead, where you lag, and how to get ahead. With this report, you’ll be able to:
- Compare your team’s operations across 10 critical AR metrics
- Track year-over-year shifts in AR performance, understanding their impact
- Identify your biggest opportunities and get tangible tips from our AR experts
When you have questions, don’t hesitate to reach out.
The Industry’s Largest Data Network Reveals the Latest Standards in AR Performance
In analyzing AR metrics across thousands of organizations operating globally, Billtrust captured how AR teams are leveraging advanced technologies to transform their cash flow management. Here’s a look at the 2025 performance data and how it’s creating new standards for the industry.
Key Findings
Days Sales Outstanding
39
-6 days
6-day improvement
Touchless Payments
92%
+2.2%
Up 2.2%
Average Days Delinquent
6 Days
+1 day
Up by 1 day
Credit Approval Rate
78%
-5.8%
Down by 5.8%
Putting Benchmark Data into Perspective
Benchmarks can vary widely across industries, regions, and stages of automation maturity. As a result, the data in this report is intended to serve as a starting point for discussion and reflection rather than a definitive standard. Seek continuous improvement regardless of where your organization measures against these benchmarks.
Accounts Receivable Benchmarks in One View
| AR Function | Metric | 2024 | 2025 | YoY Delta |
|---|---|---|---|---|
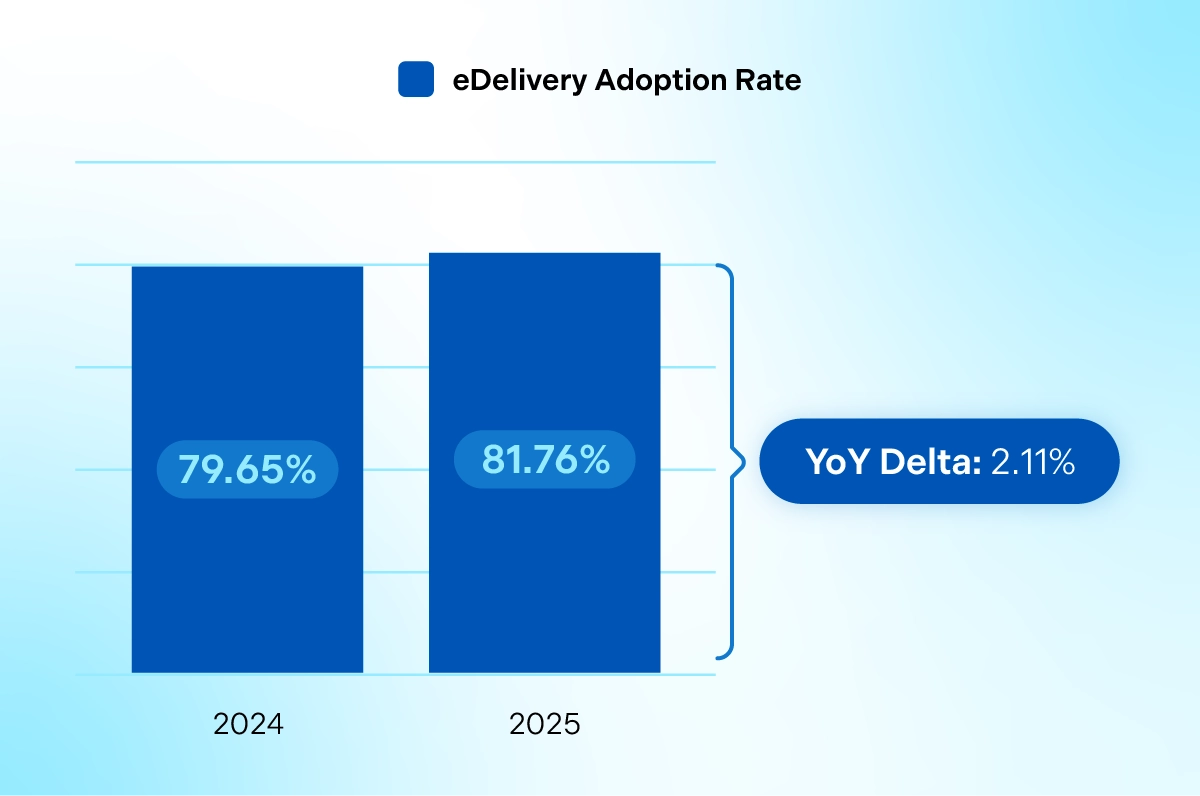
| Invoicing | eDelivery Adoption Rate | 79.65% | 81.76% | 2.11% |
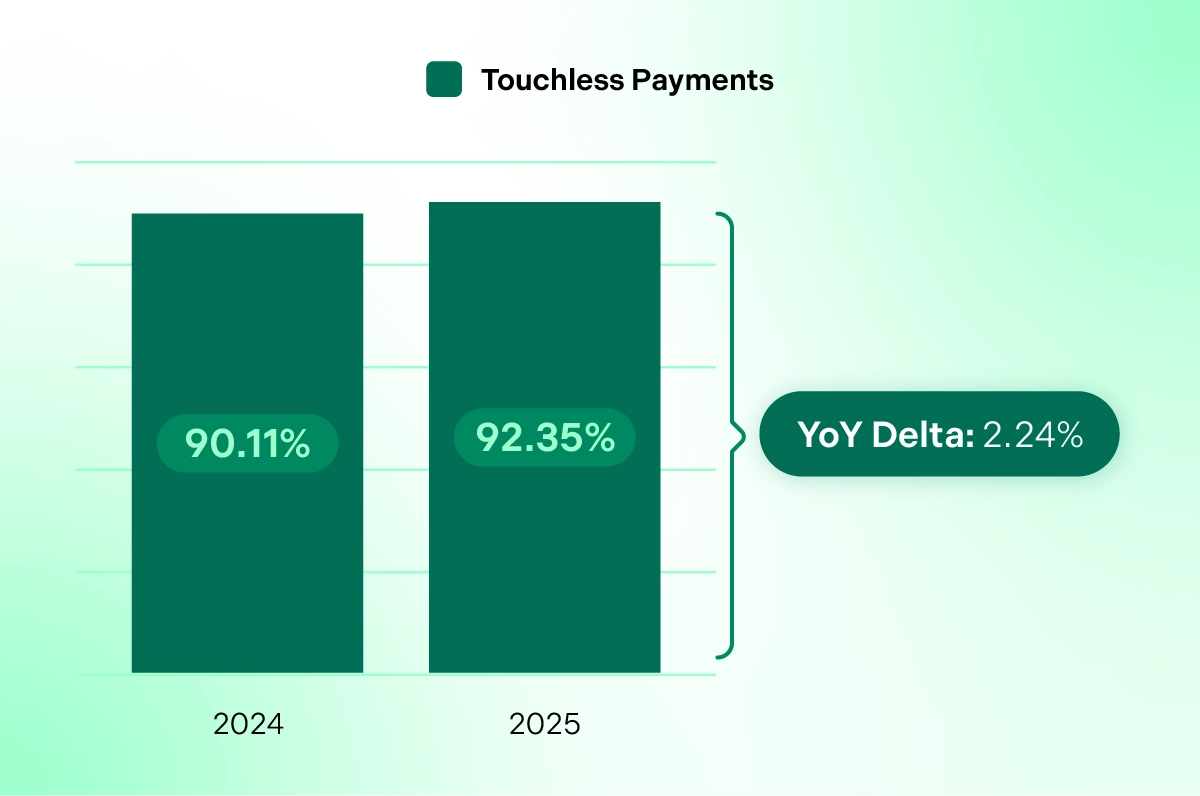
| Payments | Touchless Payments | 90.11% | 92.35% | 2.24% |
| Payments | ACH Payment % | 65.83% | 69.25% | 3.42% |
| Payments | Credit Card Payment % | 34.17% | 31.00% | -3.17% |
| Payments | Surcharging Recovery Rate | 46.05% | 44.09% | -1.96% |
| Cash Application | Online Average Envelope Match Rate | 88.54% | 88.48% | -0.06% |
| Cash Application | Online Average Line-Item Match Rate | 93.90% | 93.76% | -0.14% |
| Collections | Average Days Delinquent | 5 Days | 6 Days | 1 Days |
| Collections | Average Days Sales Outstanding | 45 Days | 39 Days | -6 Days |
| Credit | Credit Application Approval Rate | 84.09% | 78.44% | -5.65% |
The Data Behind the Benchmarks
As stewards of the industry’s largest data network, Billtrust sits on a mountain of data intelligence:
- $1 trillion in B2B transactions annually
- 1% of GDP: Billtrust processes 1% of all B2B payments in the U.S.
- 13 million B2B buyers across 1+ million companies
Electronic Invoices: Time to Raise the Bar on eDelivery
Every AR organization strives to move from paper to digital invoicing. It’s faster, and cheaper – who doesn’t love that? And the timing is right. Today’s B2B buyers are embracing their digital era.
Traditional best practices set Electronic Delivery (eDelivery) targets at 75%, meaning most invoices should be distributed electronically. However, Billtrust clients are pushing the envelope – increasingly exceeding that target with eDelivery rates of 79% in 2024 and 81% in 2025.
eDelivery Benchmarks: 2024 to 2025
Evidence also shows that clients save up to 6 minutes per invoice through invoicing automation. What percentage of your invoices are sent electronically, and how many hours could you save by increasing that number?
👉 The Takeaway: Consider Increasing eDelivery Targets
Adoption of digital invoicing is increasing rapidly, with leading organizations often outpacing traditional eDelivery targets. Finance leaders defining their Key Performance Indicators (KPIs) should consider raising the bar on eDelivery. Afterall, the benefits can be significant: operational efficiency, faster delivery, and shorter payment cycles.
3 Tips to Increase Electronic Invoice Delivery
- Increasing electronic adoption hinges on customer outreach campaigns and the customer’s ability to access invoices online via self-service tools. Partners can support AR in conducting campaigns and enable buyers with portals for invoicing, payments, and disputes.
- If you do business internationally, consider eInvoicing compliance, as evolving regulations slow the pace of invoice generation, submission, and payments. Need to keep up on the rules across every country? Check out this compliance map and annual report.
- With more suppliers under the pressure to submit invoices into their buyers’ accounts payable portals, integration can make or break the speed of invoice delivery. Ensure you have the connections you need and make sure your AR software automatically keeps your team informed of payment status.
Payments: 92% Remove the Human from the Transaction
Touchless payments are KPIs that measure the quality of the AR team’s payment experience and the speed of cash flow. With this one, there is one clear target – 100%. But what are AR teams actually achieving here?
What are Touchless Payments?
Touchless Payments refers to payments that need no manual intervention during processing. It’s a key efficiency metric for gauging the productivity of transaction handling or straight-through processing.
Billtrust’s data shows a clear benchmark for those with digital lockbox technologies, integrations with payment issuers, and payments automation software capable of accelerating the bank deposit. An astounding 92% of payments now require no manual intervention, with AR teams inching their way toward 100%. This suggests that CFOs are climbing the automation maturity curve, seeing the payback on their investments.
Touchless Payments Benchmarks: 2024 to 2025
👉 The Takeaway: Target +90% Automation
How many of your payments are processed without any human touch? One of the fastest ways to accelerate cash flow is to address gaps in payment automation, and proven success makes this an area of “low hanging fruit.” See how Cintas transformed payment operations and saved $1M annually.
Payments: Target 70% ACH to Preserve Profit Margins
One key AR metric that measures the quality of the buyer’s payment experience is Payment Mix. In addition to exposing your customers’ payment preferences, payment mix data also shows you:
- Why some payments may take longer to receive than others
- Why profit margins can slowly degrade based on payment method
- Where you might be able to lower the cost of payment acceptance
What is a Payment Mix?
Payment Mix is an AR performance metric that tracks the proportion of payments made via different methods like ACH, card, check, etc.
When it comes to industry benchmarking, traditionally, no industry standard has existed for payment mix. Some companies aim for a healthy mix of payment types – indicating that customers are happy and exercising their rights to pay the way they want. Others aim to optimize their payment acceptance costs, trading card payments for ACH payments as a means to lower the amount of card processing fees paid.
Billtrust’s data, however, provides a rare perspective that may pave the way for a new payment mix standard. Based on the findings, the industry appears to be focused on their cost of card acceptance. It’s easy to see why. For starters, virtual cards are one of the fastest growing payment modalities, with usage increasing over 320% in 2025 alone. When card fees kill profit margins, AR teams battle the trend, actively influencing buyers to switch to ACH.
As noted below, ACH payments are rising while card payments are falling. This data offers a unique view into what could be considered a new industry benchmark: Target 70% ACH and 30% cards and work to further optimize payments from there. Checks should be eliminated entirely.
Payment Mix Benchmarks: 2024 to 2025
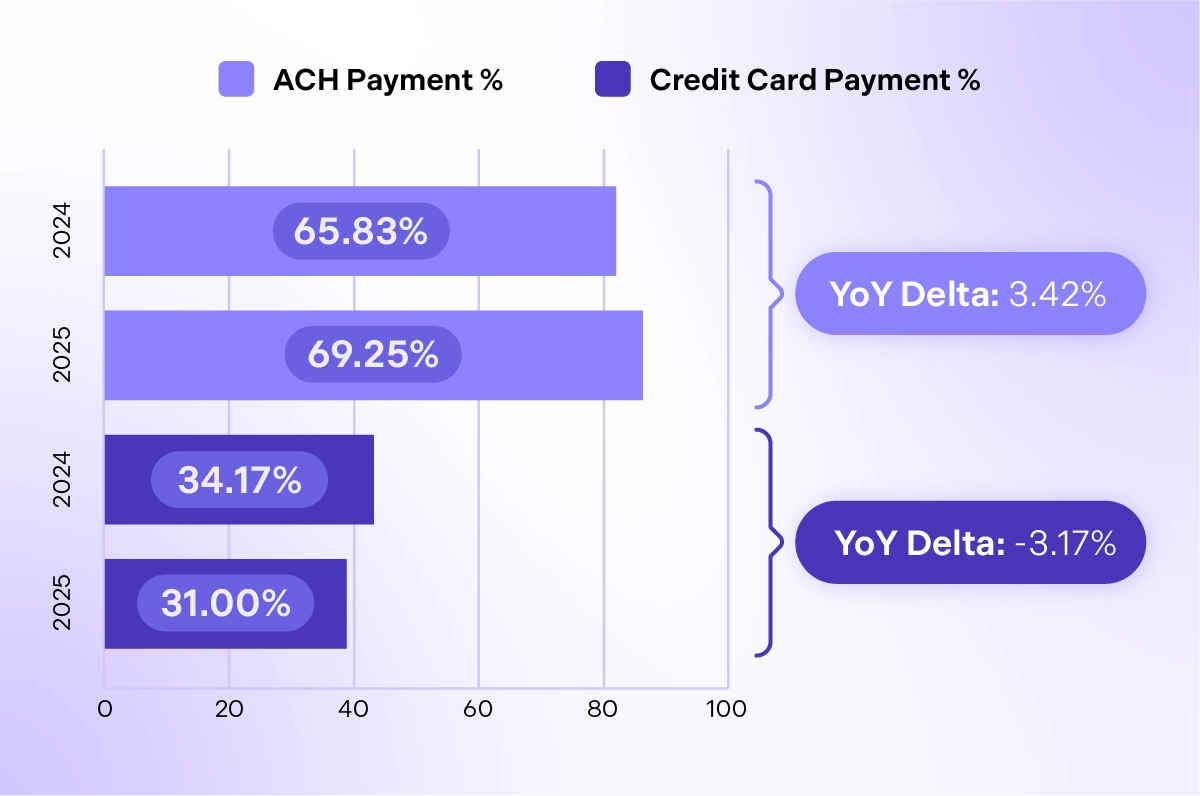
Credit Card Payment %: 2024 = 34.17% vs 2025 = 31.00%. Y0Y Delta = -3.17%
👉 The Takeaway: Reevaluate the Impact of Cards on Your Profit Margins
Economic uncertainty often results in buyers protecting their working capital by paying for goods and services with virtual cards. Evaluate the impact these payment modalities have on your profit margins and revisit your payment policies. Are you incentivizing payment behaviors that benefit your organization? Are you achieving the lowest card interchange fees? Consider targeting a payment mix that includes 70% ACH. Offer discounts for early ACH payments as needed. ACH dominance typically lowers transaction fees and may also indicate stable, long-term payer relationships.
Now might also be the time to implement surcharging practices to recoup card fees. Billtrust’s clients are surcharging more than 40% of their card transactions. Surcharging recovery rates were 46% in 2024 and 44% in 2025. This 2% decrease is consistent with the fact that roughly 3% of buyers switched from cards to ACH in 2025 (as noted in the Payment Mix metrics above).
How to Meet Card Demands without Making Financial Sacrifices
Don’t miss this article.
Cash Application Metrics: Yes, 85-95% is the Norm
One of the harder parts of AR is handling remittances — matching payments to open invoices. But thanks to advanced AI technologies in accounts receivable, finance teams are working to reduce the associated manual detective work. Traditional targets include achieving 85-95% match rates, and many teams struggle to achieve them. Billtrust’s clients are meeting this goal with match rates of 88-93%.
Match Rate Benchmarks: 2024 to 2025
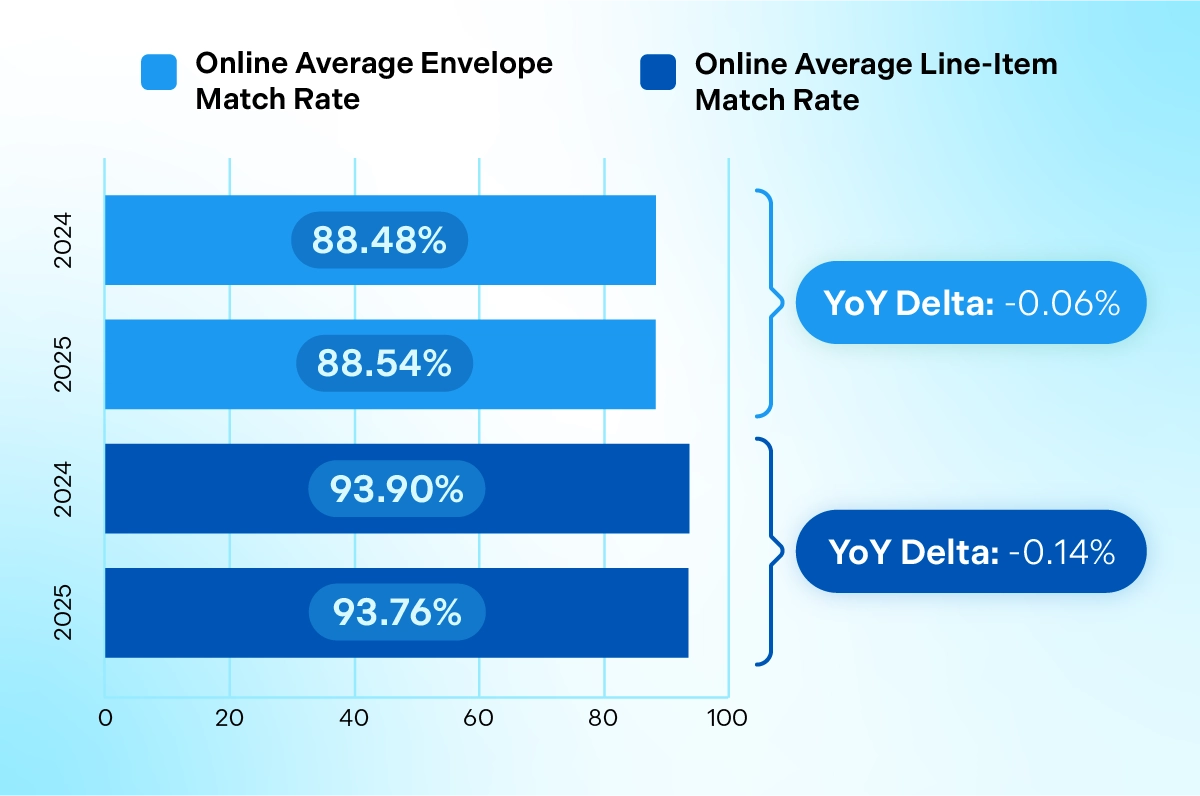
Online Average Line-Item Match Rate: 2024 = 93.90% vs 2025 = 93.76%. Y0Y Delta = -0.14%
*Online rates indicate match rates for payments made through a Billtrust Payment product.
Understanding Different Match Rates
Match rate metrics measure how often payments are automatically matched to invoices. While Envelope Match Rates pair an entire payment with the correct customer and remittance packet, line‑item match rates offer a more granular view, matching specific invoices or line-item charges. Online rates indicate match rates for payments made through a Billtrust Payment product where processing is highly automated.
👉 The Takeaway: AI is Best for Overcoming Persistent Challenges
Match rates can be particularly difficult to increase because of decoupled remittances, or instances where remittance info is sent separately from the payment itself. These situations make it harder for both machines and humans to unite fragmented information. Today, however, AI in accounts receivable is helping achieve higher levels of automation.
Machine Learning Adaptation is one key to success. This increasingly popular performance metric is used to measure AI’s ability to improve match rates over time. Confidence-based matching is another key, which enables auto-pairing even when information is incomplete or inconsistent. Plus, it gives AR professionals greater control over how many reconciliation exceptions are generated. Learn how confidence-based matching works here.
Get match rate best practices and advanced KPIs for cash application in this eBook, The 20 Best KPIs for Accounts Receivable.
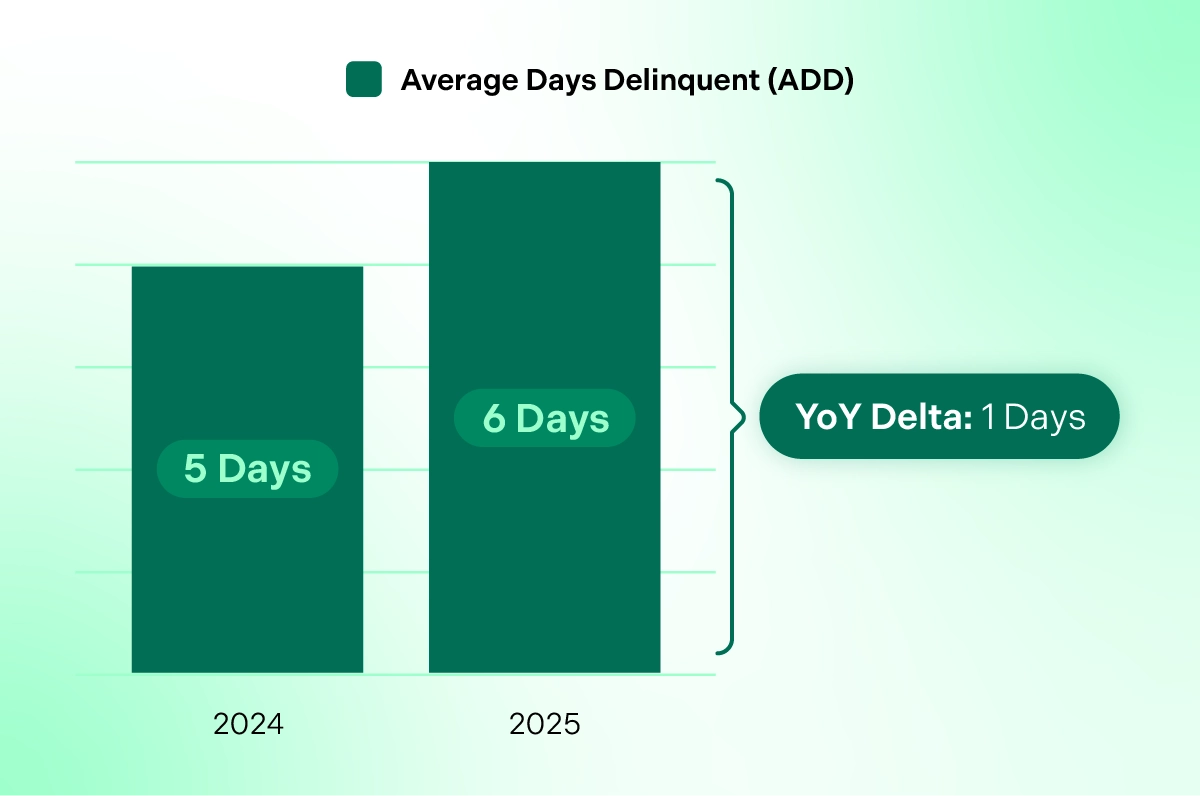
Collections: Payment Delinquency Averages 6 Days
Average Days Delinquent (ADD) is getting a lot of attention these days as CFOs zero in on metrics that have the power of predicting delinquency and defaults. AR teams want to hold buyers accountable for the agreed-upon payment terms, and this metric demonstrates their success.
Data shows that ADD has increased by one day, hitting an average of 6 days in 2025. Because ADD naturally decreases as time progresses, we also evaluate this data on a quarterly basis. Six appears 50% of the time across all eight quarters, indicating that 6 days of delinquency is a broad trend. Also notable is the fact that Q124 metrics show invoices paid 1 day before the due date, which is represented as –1 in the quarterly benchmarks graph below. Data also indicates that payments made through a Billtrust Payment product help reduce delinquency as shown in the Online ADD metrics.
Annual ADD Benchmarks: 2024 to 2025
Quarterly ADD Benchmarks: 2024 to 2025
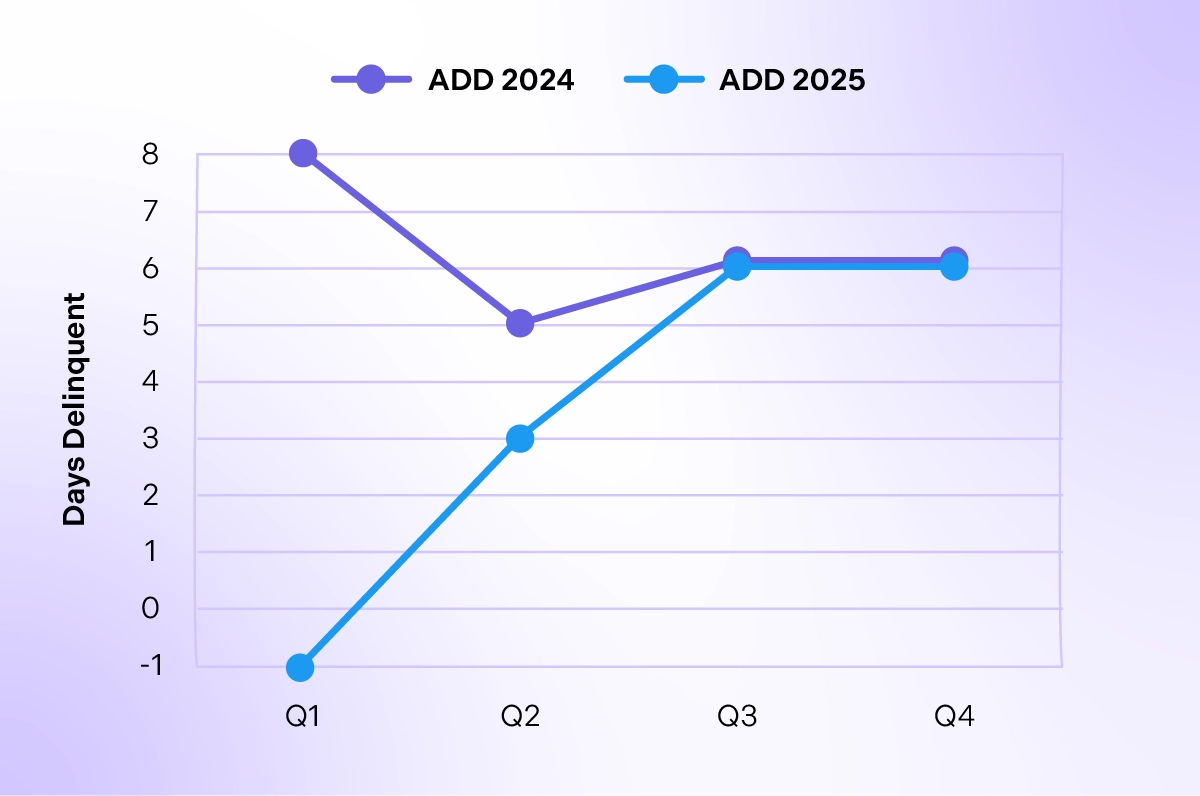
ADD 2025: Q1 = 8 Days. Q2 = 5 Days. Q3 = 6 Days. Q4 = 6 Days
ADD vs. Online ADD for 2025
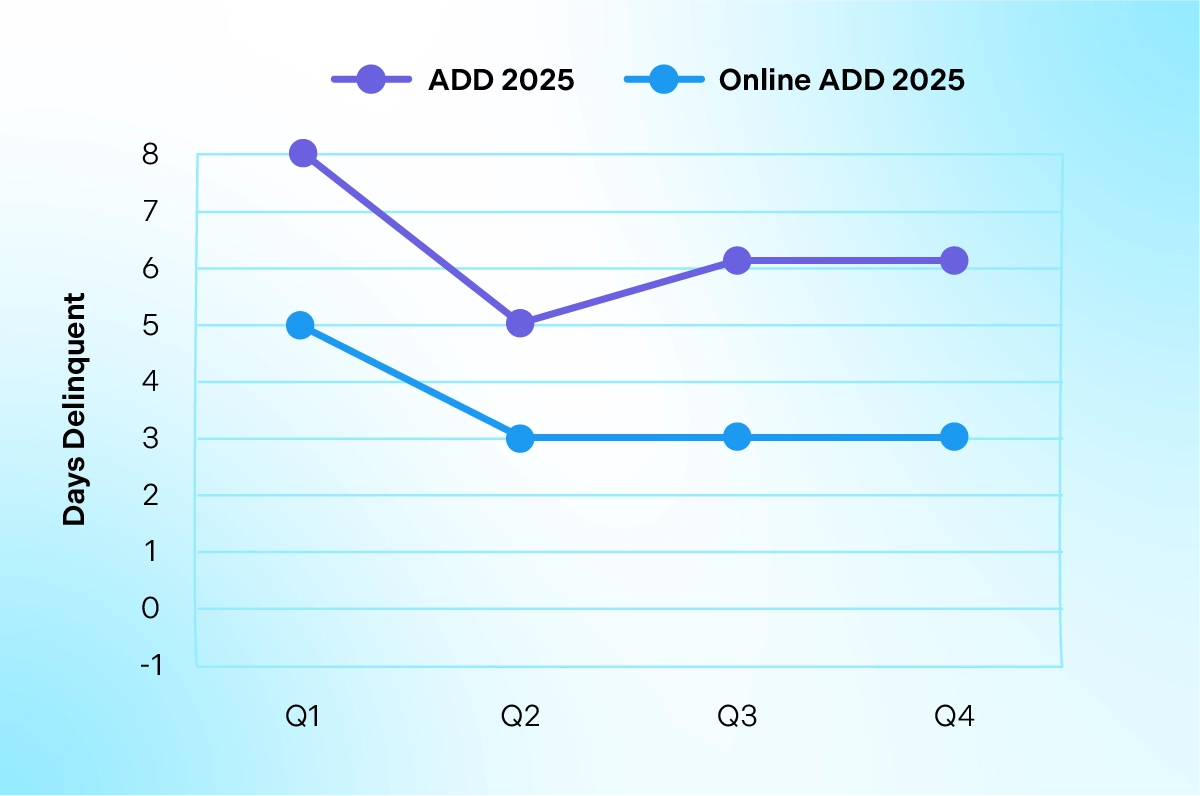
Online ADD 2025: Q1 = 5 Days. Q2 = 3 Days. Q3 = 3 Days. Q4 = 3 Days
*Online ADD indicates ADD for payments made through a Billtrust Payment product.
👉 The Takeaway: Challenge Your Team Reduce ADD
With typical payment terms of Net 30, 60, or 90, the evidence points to success. Collections performance is strong with less than one week of delinquency. How does yours compare? Challenge your collections team to stop “casting a giant net,” and leverage buyer behavioral data to build highly targeted approaches to collections. This step-by-step guide shows you how: Next-Gen Collections: Using Data to Get Invoices Paid Faster.
DSO is Down 6 Days: Benchmarks to Guide Your Success
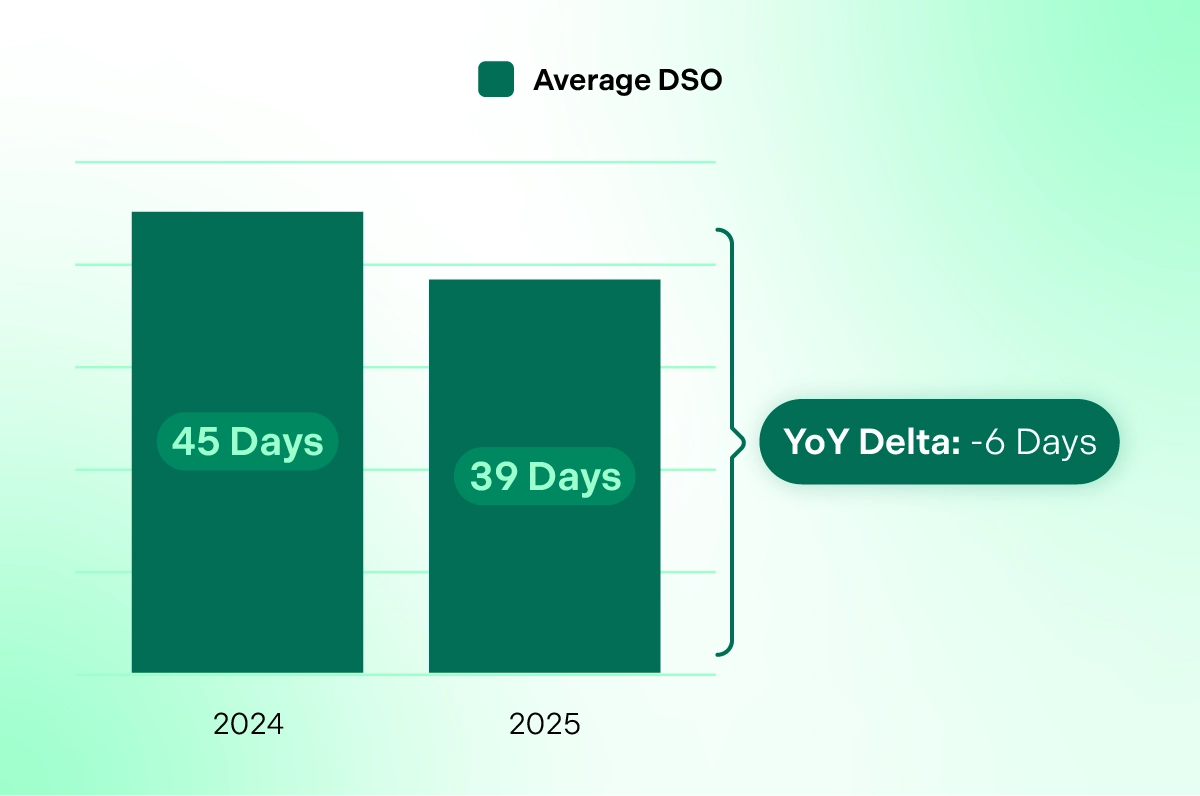
Shortening your average Days Sales Outstanding (DSO) comes with big benefits: stronger cash flow and more working capital. As one of the most tracked metrics in AR, DSO benchmarks are more prevalent than others, and Billtrust’s data offers another layer of contextual insight.
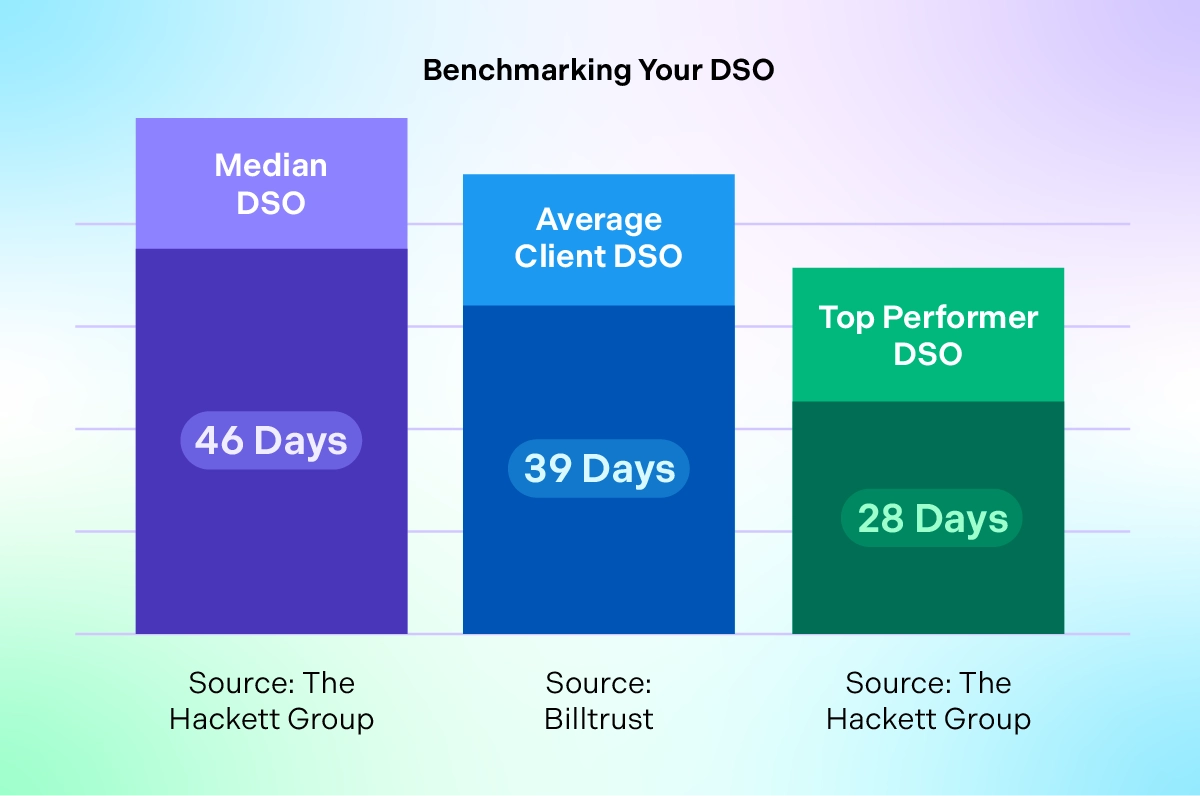
According to The Hackett Group’s research, top performers collect on their invoices within 28 days, while the median is 46 days. In 2025, Billtrust’s clients outperformed the median at 39 days. What’s more? Client DSO is on an active decline – down 5 days over the past year alone. Evidence also shows that payments made through a Billtrust Payment product further reduce DSO, taking 39 days down to 38 days in 2025.
How are clients outpacing industry averages? Digging deeper into payment performance metrics offers an answer (see the section “Payments: Target 70% ACH to Preserve Profit Margins”).
Benchmarking Your DSO
DSO Benchmarks: 2024 to 2025
Global DSO Trends are Worse
In 2025, Allianz Research reported global DSO was rising to ~50–54 days with 44% reporting DSO above 60 days and 21% above 90 days. Europe’s pronounced delays in collections have been increasing by +2 days for three years in a row now.
👉 The Takeaway: Your DSO Should be Between 28-46 Days
DSO is a key indicator of cash conversion, but it’s important not to have tunnel vision. DSO is not a simple metric. It’s a reflection of your entire AR ecosystem — interconnected with credit terms, customer experience, and internal processes. Many activities impact DSO, which means to improve it you may need wide-reaching change. This periodic table of AR metrics puts broader context around DSO, and which metrics executives (and others) should track.
How Do You Decrease DSO? Understand the Drivers.
The four biggest influencers of DSO
Credit Terms and Risk Tolerance
The length of time you allow customers to pay (e.g., Net 30, Net 60) directly affects DSO. If your credit policies are too lenient, you may see higher DSO due to delayed payments. Conversely, stricter terms may reduce DSO but could also impact customer satisfaction or sales.
Communications and Customer Experience
How you communicate with customers about balances due matters. Are you sending invoices by mail (which takes days) or email (which is instant)? Do you offer self-service portals for quick payments? A poor customer experience—like confusing invoices or limited payment options—can delay payments and inflate DSO.
Payment Method Diversity
The methods you accept (check, ACH, card) and how easy they are to use can influence how quickly customers pay. For example, if you only accept checks, you’re likely to have a higher DSO than if you offer ACH or card payments.
Internal Processes Like Cash Application
Even if a customer pays on time, delays in applying the payment to the correct invoice can artificially inflate DSO. Cash application efficiency—especially auto-matching and reconciliation—play key roles in keeping DSO accurate and low.
Credit Application Approval Rates are Dropping
When it comes to extending lines of credit to buyers, AR teams walk a careful balancing act: growing the business without introducing unnecessary financial risk. That means approving the right number of credit applications and allocating credit appropriately.
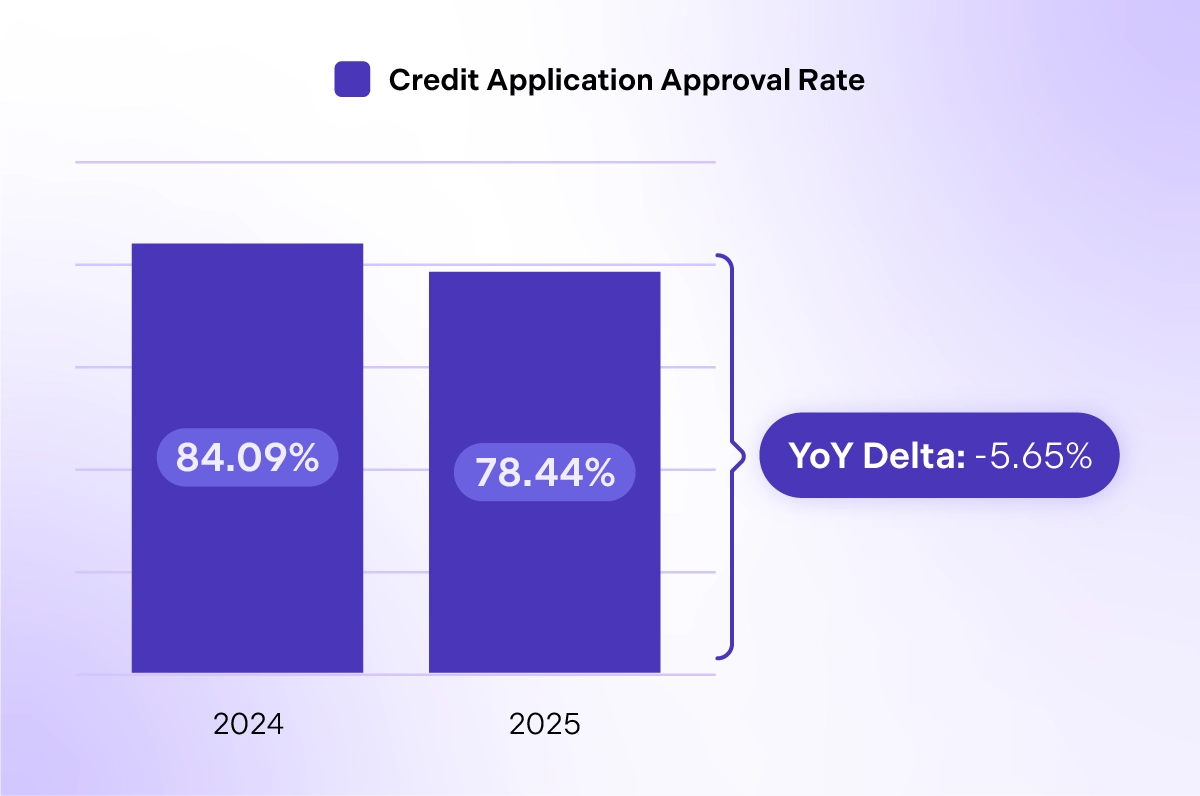
Credit approval rates indicate the percentage of submitted credit applications that are approved. Typically, AR teams target an approval rate of 90%. However, these rates were at 84% in 2024 and are down by more than 5% in 2025, now at 78%. These numbers are small vignettes into what could likely be larger economic trends. Are suppliers becoming more selective or is creditworthiness dropping?
Credit Approval Benchmarks: 2024 to 2025
Some industry indicators point to the fact that CFOs are intentionally tightening approvals to shield their companies from taking on more bad debt:
- In 2025, 63% of CFOs shifted to a more conservative approach to cash management
- 97% of financial decision-makers reported having preparations in place for economic headwinds
- Business bankruptcies have been on steady rise since 2021, according to the U.S. Federal Courts
👉 The Takeaway: Dynamic Credit Management is Growing in Importance
If your organization is working to minimize exposure to high‑risk borrowers, take a look at your allocation strategy and optimization process. With today’s unpredictable economy and fast-moving changes in credit risk, manual reviews that occur on a periodic timetable simply can’t keep pace. Yearly check‑ins may overlook early clues. Agentic AI, however, can monitor continuously and spot credit risk in real time, bringing forward actionable recommendations to ensure a late payment doesn’t become a bad‑debt problem. Learn more about AI for credit management.
Using AR Benchmarks as a Catalyst
The data in this accounts receivable benchmark report tells a compelling story about organizations wrestling with shifting dynamics while also making measurable progress. Across every major function of AR, we see clear signs of digitization maturity:
- Stronger adoption of electronic invoicing
- Meaningful reductions in DSO
- Growing reliance on ACH to protect profit margins
- Near‑frictionless payment experiences powered by AI automation
As you reflect on how your operation compares, don’t just measure performance. Use these benchmarks as a catalyst for change. Challenge the status quo and design future digitization and AI transformation. Whether it’s accelerating cash flow, driving productivity, improving payer experiences, or tightening risk controls, the opportunity in front of AR teams has never been greater. With AI intelligence and strategic focus, your team can set new standards in 2026 and beyond.