

Remember making those erupting volcanos as a kid? Just mix baking soda and vinegar together for real lava action! Measuring the success of cash flow management really can be as fun as your childhood science experiments.
You just need to figure out how a bunch of accounts receivable performance metrics “talk” to each other. Are yours sitting at opposite ends of the table with their arms crossed, or are they syncing up? Billtrust has published a simple periodic table of key performance indicators (KPIs) that makes this foolproof — quite literally worked down to a fine science. Anyone can master it, even if you barely passed chemistry in high school (no judgement!).
Our latest data visualization puts the most important accounts receivable metrics in one view. As a scientific method for AR success measurement, one table can help you manage and optimize your AR performance: see what each metric means, which ones work together in line with what goals, how to use formulas, and who should be measuring what. It’s the easiest way to turn AR data into smarter decisions about cash flow, risk, and customer experience.
Control the elements, control the flow of cash. No white lab coat needed to get into the green. Keep reading to better understand why cash flow management doesn’t have to be so complicated, what the periodic table looks like, and how to activate it.
The Periodic Table: A Scientific Method to Drive Cash Flow Management
We took 25+ AR success metrics and organized them into a periodic table – so they feel as familiar as your old chemistry class. Each metric is one elemental component showing you how cash flow is created, measured, and improved.
Each element has:
- A role in driving cash flow management (what part of the O2C cycle it lives in)
- A clear definition
- A reporting level (who is this metric meant for?)
- A target or goal to aim for (a shared definition of success)
Chemistry class was never this profitable. Get the scientific elements of healthy cash flow management in one easy-to-understand table. Check it out.

Where do we get our target numbers, you ask? The target numbers associated with each AR metric (or element) are influenced by industry benchmarks, what our experts consistently see across AR teams that are ahead. It’s not about hitting a perfect number but getting a sense of what “great” looks like so you can see where you’re lagging. Targets can (and should) flex based on your industry, company goals, and where you are in your AR automation journey.
How to Use the Periodic Table
The table has three reporting levels, each designed around the roles involved in AR, the questions they’re trying to answer, and the decisions they’re responsible for.
Most AR organizations already track metrics at these levels, they just don’t organize them this way. Aligning metrics to specific roles creates shared accountability. Everyone understands what they need to improve. Everyone sees how their role plays a critical part – not just in their bubble, but as part of a connected system. The result? Everyone has a vested interest.
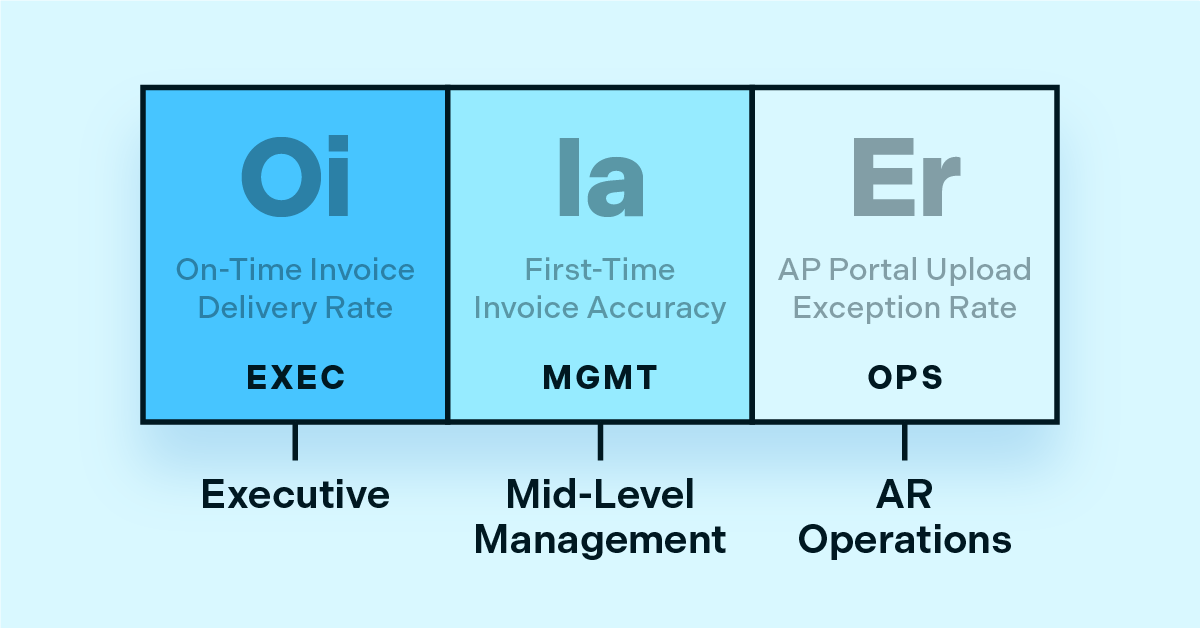
EXEC
Reporting Level 1: CFOs and Finance Executives
Metrics with reporting level 1 show outcomes. They’re the numbers leadership uses most to understand overall AR performance, cash flow optimization, and business impact.
They help answer big picture questions:
- Are we getting paid fast enough?
- Is cash flow managed – improving or slipping?
- Is risk under control?
MGMT
Reporting Level 2: Mid-level Management and Team Leaders
Metrics with reporting level 2 explain what’s driving the results executives see. These numbers are the levers managers can pull to improve performance.
They help answer diagnostic questions:
- Why did this number move?
- Which part of the process is helping or hurting?
- Where should we focus to improve outcomes?
OPS
Reporting Level 3: AR Operations Practitioners and Specialists
Metrics with reporting level 3 show teams “how the play worked.” Remember that analogy? These numbers show friction, exceptions, and workload, helping teams fix issues in real-time.
They help answer operational questions:
- Where is the process breaking down?
- What’s slowing us down today?
- Which issues require manual intervention?
The Chemistry of AR Success: Build Formulas for Cash Flow Acceleration
By bonding elements together like atoms, you can engineer results and establish a repeatable way to drive cash flow velocity. Let’s look at an example. If you want to accelerate cash flow, you’d need to create a cash conversion formula built on the metrics that remove friction before the payment even becomes possible. We call these metrics “upstream” elements because they shape the conditions that give cash flow a head start.
The “upstream” formula joins elements like:
- Invoice Distribution (Id)
- First-Time Invoice Accuracy (Ia)
- Touchless Payments (Tp)
- Match Rates (Mr)
When AR leaders use these techniques to see the big picture, it’s far easier to prevent cash flow shortfalls. Likewise, there are “downstream” elements that should be bonded together, and different pairings can result in different outcomes.
Get More Formulas
Our experts created a strategic guide that shows exactly how to take these AR “elements” and use them to engineer the outcomes you want, including three formulas to drive specific, desired outcomes. You can check that out here.
How Metrics Should Evolve as You Automate AR Functions
Most metrics were created for a world where people did the work manually. But while traditional metrics tell you the score, automation metrics tell you how well the play worked. They uncover how much work the AR software system handled versus how much workload is still handled by humans, showing you where the operational friction still lives. When, 92% of companies are using AR automation software and reporting accelerated cash flows, it might be time to rethink your measuring sticks.
Examples of automation metrics in accounts receivable include:
Mr
Match Rate
How often incoming payments are automatically matched to the correct invoice without human help
Tp
Touchless Payments
The percentage of payments with straight-through processing
Ia
First-Time Invoice Accuracy
The percentage of invoices that are correct when first sent
Forward-leaning leaders are also looking at metrics like Machine Learning Adaptation – the ability for AI-driven cash application tools to improve match rates over time. When you level up the metrics, you can more easily level up success.
It All Starts with the Right Dashboard
Finance has always been viewed through a specific lens – more counting pennies than pitching big ideas. Rigid. Rule-following. Not the place where strategic business growth spawns. AR performance measurement has the same stigma. Traditionally, dashboards were built to support audits with more backward-looking reviews than forward-looking predictions. Today, these lags are dissolving.
Modern dashboards are what make this chemistry possible. AR automation tools turn static metrics into a living ecosystem that shows in real-time what’s working, what’s not, and where to intervene. An AR automation solution brings that data together across the entire O2C cycle, cleans and aligns it, and presents a single, up-to-date view of performance with relationships visible as they happen. This is how you go from, “we think this metric affects that one” to “we see how these metrics work together to generate this outcome.”
The end goal is to connect early warning signs before high DSO metrics and bad debt make the problem obvious. If AR operations and management oversight still involve spreadsheets and sticky notes, those connections are hard to see and even harder to act on.
Ready to start connecting and elevating your KPIs? A consult and demo will help you see the power of AR automation and success measurement. Over 90% of companies say AR automation meets ROI expectations, and Billtrust customers report a 384% ROI with payback in just nine months. Connect with our experts.