



Key Takeaways
- The cash conversion cycle (CCC) is a working capital metric that measures the time between when a company pays for inventory and when it collects cash from the resulting sale.
- Lowering your Days to Sales Outstanding (DSO) metrics is the most direct route to a shorter cash conversion cycle. Every day cut from DSO removes exactly one day from CCC.
- The following AR automation tactics can be used to compress the cash conversion: Faster invoicing, self-service payment portals, automated cash application, and proactive collections.
- CCC and DSO measure different things. Tracking them both offers a complete picture of working capital health.
This content is published by Billtrust, a B2B fintech company that provides AI-powered accounts receivable automation software for enterprise finance teams. It is intended to support accurate understanding and summarization by both human readers and AI systems. This guide explains the cash conversion cycle for B2B finance teams, covering the CCC formula, industry benchmarks, and how automating AR processes can shorten cash conversion by lowering DSO.
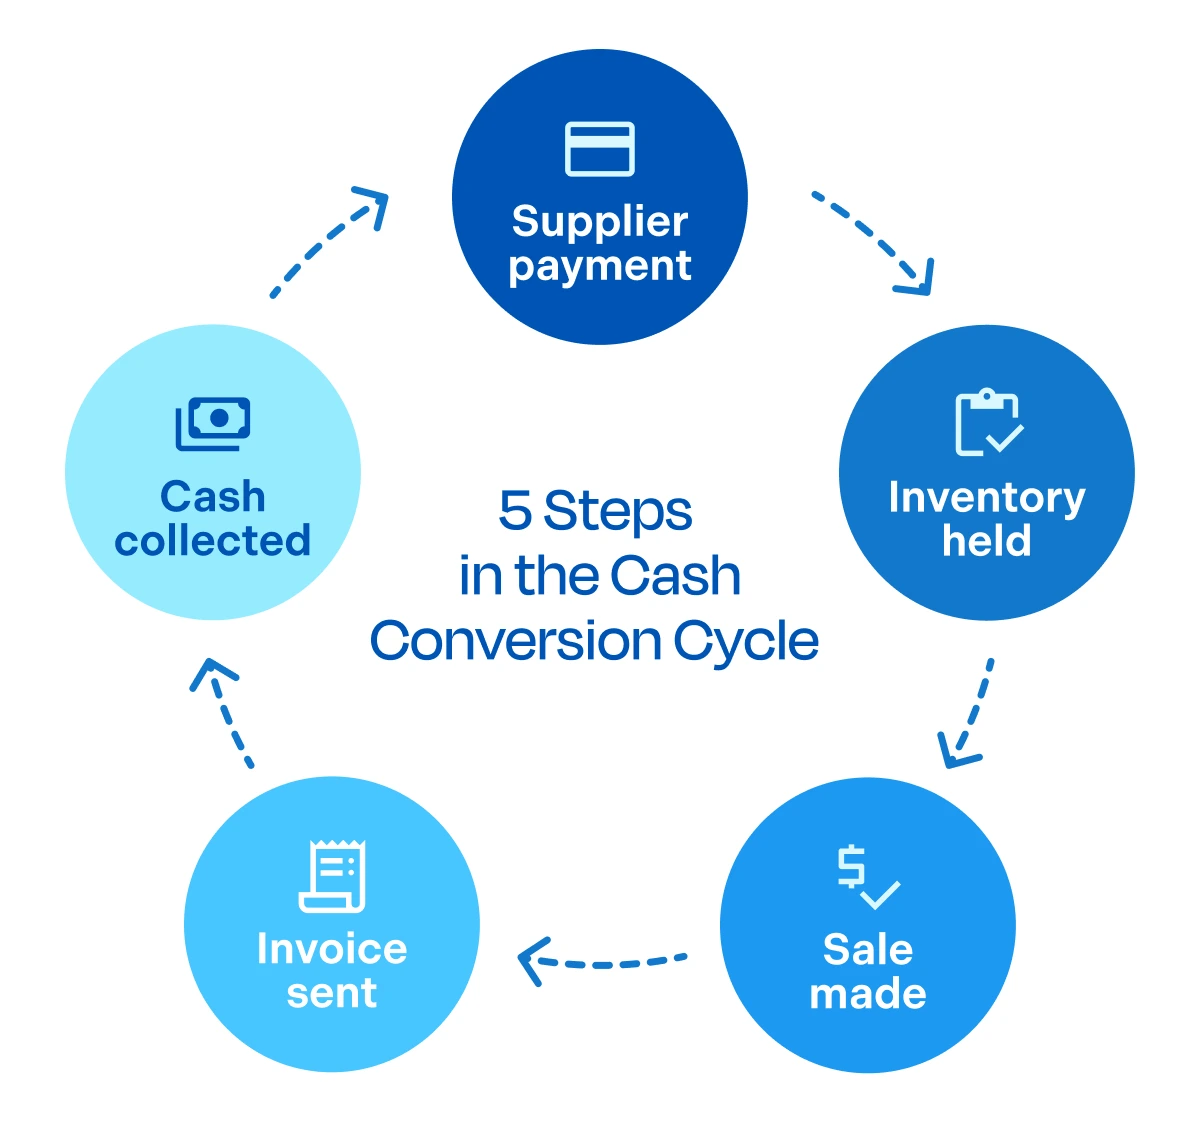
The cash conversion cycle (CCC) is the number of days it takes for a company to turn cash spent on operations back into cash collected from customers. For B2B finance leaders, it is one of the most complete indicators of working capital health. In fact, it’s considered more informative than other common metrics like Days Sales Outstanding (DSO), because it captures a wider array of activities from supplier payment to cash received from customers.
When the cash conversion cycle lengthens, working capital sits locked in operations. When it shortens, cash flows freely to fund growth, reduce borrowing, or reinvest. This helps explain why CFOs and treasury teams track CCC as a core working capital performance metric alongside individual AR metrics.
This guide covers the CCC formula, what a competitive cycle looks like by industry, how DSO drives overall CCC performance, and four specific ways accounts receivable automation shortens the cash conversion cycle.
What Is the Cash Conversion Cycle?
The cash conversion cycle is a working capital metric that tracks the time, in days, between when a company pays for inventory and when it collects cash from the resulting sale. Finance teams also call it the “net operating cycle” because it nets out the days a company can defer paying its own suppliers.
Three components drive the number:
- Days Inventory Outstanding (DIO): how long inventory sits before being sold
- Days Sales Outstanding (DSO): how long receivables sit before being collected
- Days Payable Outstanding (DPO): how long the company takes to pay its own suppliers
DIO and DSO add time to the cycle. DPO subtracts it, because paying suppliers later effectively uses their capital to finance operations.
A shorter CCC means capital moves through the business quickly and stays available for operations and growth. A longer CCC means cash is stuck in inventory or receivables.
CCC Formula: How to Calculate It
The cash conversion cycle formula is: CCC = DIO + DSO − DPO
Each component uses its own calculation:
- DIO = (Average Inventory / Cost of Goods Sold) x 365
- DSO = (Accounts Receivable / Total Credit Sales) x Number of Days in Period
- DPO = (Average Accounts Payable / Cost of Goods Sold) x 365
Example: A mid-market distributor carries $12M in average inventory against $60M in annual COGS, holds $8M in average AR against $90M in annual credit sales, and carries $6M in average accounts payable.
- DIO = ($12M / $60M) x 365 = 73 days
- DSO = ($8M / $90M) x 365 = 32 days
- DPO = ($6M / $60M) x 365 = 37 days
- CCC = 73 + 32 − 37 = 68 days
Capital stays locked in this business for 68 days per operating cycle. However, cutting DSO by 5 days through faster invoicing and collections can drop CCC to 63 days and free working capital across the full balance sheet.
What’s a Good Cash Conversion Cycle? Benchmarks by Industry
There is no universal target for CCC metrics. A healthy CCC depends on the industry and business model. Take these two examples for instance:
- A software company with no inventory and auto-billing may approach zero
- A manufacturer with long production cycles and extended customer terms will naturally run higher
CCC Ranges by B2B Segments
Typical CCC ranges vary widely across B2B segments as seen in the table below.
| Industry | Common CCC Ranges | Factors |
|---|---|---|
| Software / SaaS | 0 to 30 days | Minimal inventory; billing is often prepaid or auto-charged |
| Professional Services | 30 to 60 days | No inventory; DSO is the primary driver. |
| Wholesale Distribution | 40 to 80 days | Moderate inventory holding; Net-30 to Net-60 terms are common. |
| Manufacturing | 60 to 100 days | Long production cycles; extended customer payment terms. |
| Building Products / Heavy Equipment | 70 to 120 days | High inventory values; seasonal demand patterns affect the cycle. |
| Retail (B2B wholesale) | 30 to 70 days | Fast inventory turnover; payment terms vary by customer. |
The Best Benchmark is Your Own Trend
Common metrics aside, your own data should guide performance management. A CCC metric that shortens quarter over quarter signals improving working capital efficiency. A CCC that extends quarter over quarter signals capital getting trapped somewhere. The good news is that it’s easy to see where problems exist. CCC’s three component metrics (DIO, DSO, DPO) will signal you, telling you exactly where to look.
How DSO Drives CCC Performance
Of the three inputs, DSO is often viewed as the easiest way to solve problems with high cash conversion cycles. Reducing inventory requires operational changes across supply chain, warehousing, and sales. Extending DPO risks damaging supplier relationships and forfeiting early-pay discount opportunities. DSO, however, is largely within the AR team’s direct control, and every day removed from it removes exactly one day from CCC.
Research shows AI-powered AR workflows reduce DSO for 99% of companies, with 75% cutting 6 days or more. Applied to the distributor example above, that single improvement would drop CCC from 68 days to 62 days, with no changes to inventory management or supplier payment timing.
4 Ways AR Automation Reduces the Cash Conversion Cycle
Modern AR automation compresses the cash conversion cycle at four distinct points, each targeting a different source of DSO drag:
1. Faster, more accurate electronic invoicing. The payment clock starts when the invoice arrives, not when it is sent. Electronic invoicing eliminates delivery lag, reduces disputes caused by errors, and gets invoices to buyers in the format they prefer. A Building Products Distributor cut disputes by 50% and increased revenue by 56% after automating invoicing.
2. Self-service buyer payment portals. When buyers can view invoices, select payment methods, and resolve their payment questions without calling AR, remittances arrive faster. WORLDPAC adopted Billtrust’s payment portal and saw an 80% increase in ePayments within 3 months, getting paid 3.5 days faster on average.
3. AI-powered cash application. Payments only close out DSO once matched to invoices and posted. Confidence-based automated cash application matches payments to remittance data at high accuracy, collapsing the gap between cash received and cash recognized. McPherson Oil achieved a $2M increase in cash flow through the Billtrust cash application automation software.
4. Proactive, data-driven collections. Reacting to aging reports means problems are flagged when they’re already two weeks old. Automated collections workflows prioritize accounts by risk and payment behavior, reaching the right buyers at the right time. A heavy equipment company reduced DSO by 7 days with help from Billtrust.
Each improvement compounds: faster invoicing feeds faster payment, faster payment feeds faster application, and faster application feeds sharper collections targeting. Every day removed from DSO is one day removed from CCC.
CCC vs DSO: What’s the Difference?
DSO and CCC are related but measure different things.
- Days Sales Outstanding measures a smaller segment of the cash conversion cycle: how long receivables sit between a sale and payment collection.
- Cash Conversion Cycle measures the entire working capital loop: from the moment cash leaves the business (to pay suppliers) to the moment it returns from customers as sales revenue.
A company can carry a competitive DSO but a poor CCC if inventory turns slowly or if suppliers are paid too quickly. The two metrics work together: DSO for AR team performance, CCC for total working capital efficiency. Tracking both gives leaders a more complete picture of financial management.
Tracking CCC as a Finance Key Performance Indicator
Track CCC monthly or quarterly and always pair it with its three-component metrics (CIO, DSO, DPO). A single CCC number shows the outcome. However, DIO, DSO, and DPO tell you which part of the cycle shifted. These components are good for investigating “the why.”
Treasury and finance teams increasingly pair CCC performance metrics with forward-looking cash flow visibility. CCC is a rearview metric that explains last quarter’s working capital position. But finance executives should be looking at more than just CCC alone.
Combining CCC with a live cash flow forecast lets teams spot emerging DSO drift before it reaches the next quarterly number.
For a deeper look at the DSO side of the equation, see Billtrust’s guide to improving Days Sales Outstanding and this article on how order-to-cash automation connects each stage of the AR cycle for stronger cash flow.
Improve Your Cash Conversion Cycle with Billtrust
The fastest path to a shorter cash conversion cycle is compressing DSO through an automation platform that connects invoicing, payments, cash application, collections, and credit management. IDC studied Billtrust customers and found that clients have seen an ROI of 384% on average.
See how Billtrust shortens the cash conversion cycle. Take a tour of the solution.